samadhi
A realtime EEG viewer using novel ways to visualise EEG.
Project maintained by jkanev Hosted on GitHub Pages — Theme by mattgraham
Samadhi EEG / LSL
Samadhi EEG is a project to build a Python/Qt/OpenGL based application for visualising EEG and spectrum data in novel ways. Hooking onto an LSL stream, the software monitors and displays EEG at realtime. The project has just started, implementation is not mature yet and the content is mainly experimental.
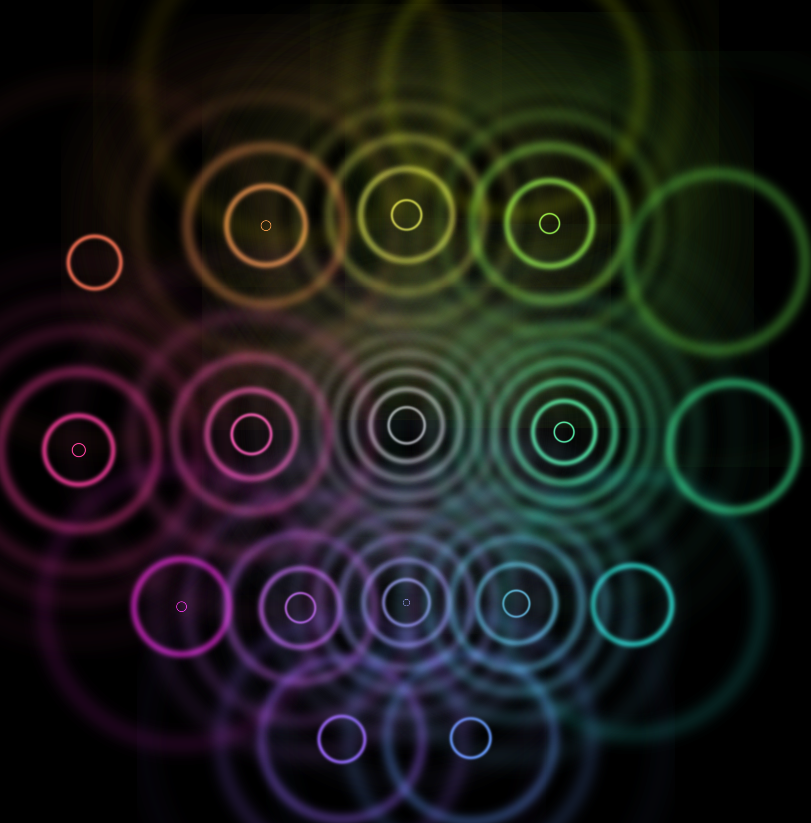
Display: Dancing Dots
A wavy, rotating, jelly-fish like flower made up of single dots. This is a spectrum display, visualising the current value of the EEG frequency bands Delta, Theta, Alpha, Beta and Gamma.
 The data from the spectrum analysis is averaged over rings of different lengths, arranged in concentric circles. The hills and valleys of the sine waves add up or cancel out, depending on their frequency and the circumference of the circle, creating a flower-like pattern with different colours and rotations.
This means the frequency of the spectrum band is represented in the symmetry of the dot display:
The data from the spectrum analysis is averaged over rings of different lengths, arranged in concentric circles. The hills and valleys of the sine waves add up or cancel out, depending on their frequency and the circumference of the circle, creating a flower-like pattern with different colours and rotations.
This means the frequency of the spectrum band is represented in the symmetry of the dot display:
| Delta | Theta | Alpha | Beta | Gamma |
|---|---|---|---|---|
 |
 |
 |
 |
 |
The actual display will be a superposition of these. Inside and outside colours are configurable per frequency band, symmetry pattern are configurable, and in/out motion direction. dancing dot flower display runs first inside the window, a mouse click brings it to full-screen (and back again). This display uses hardware acceleration (OpenGL).
Display: Radiant Ripples
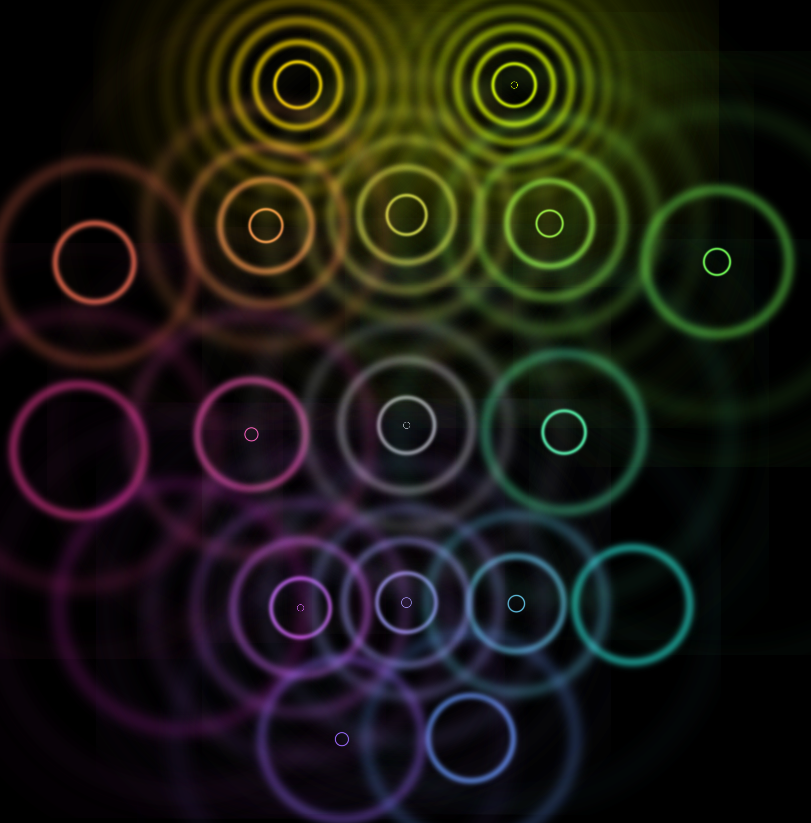
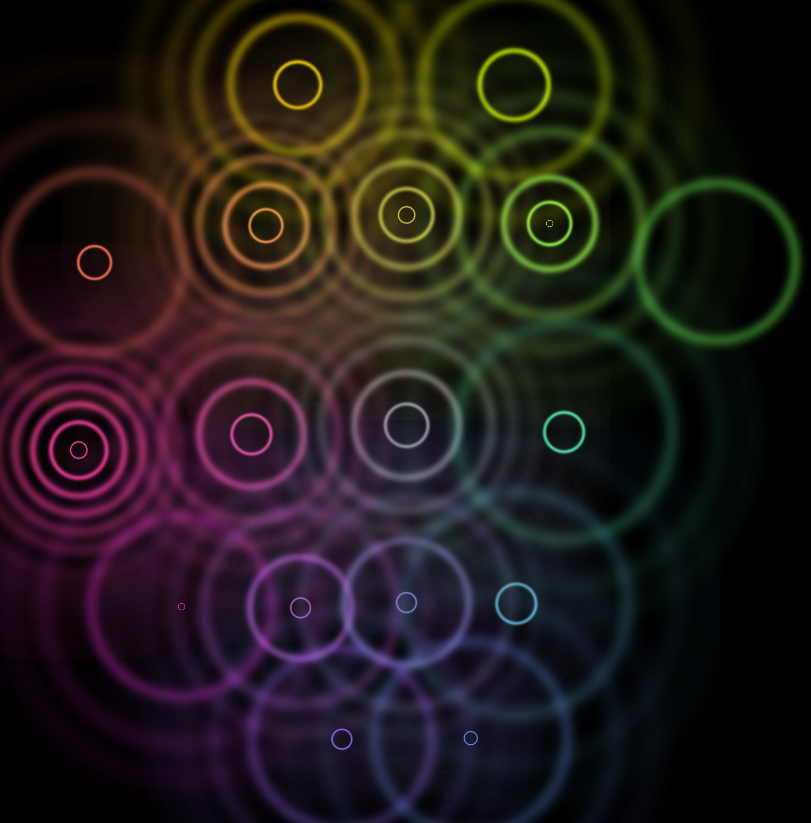
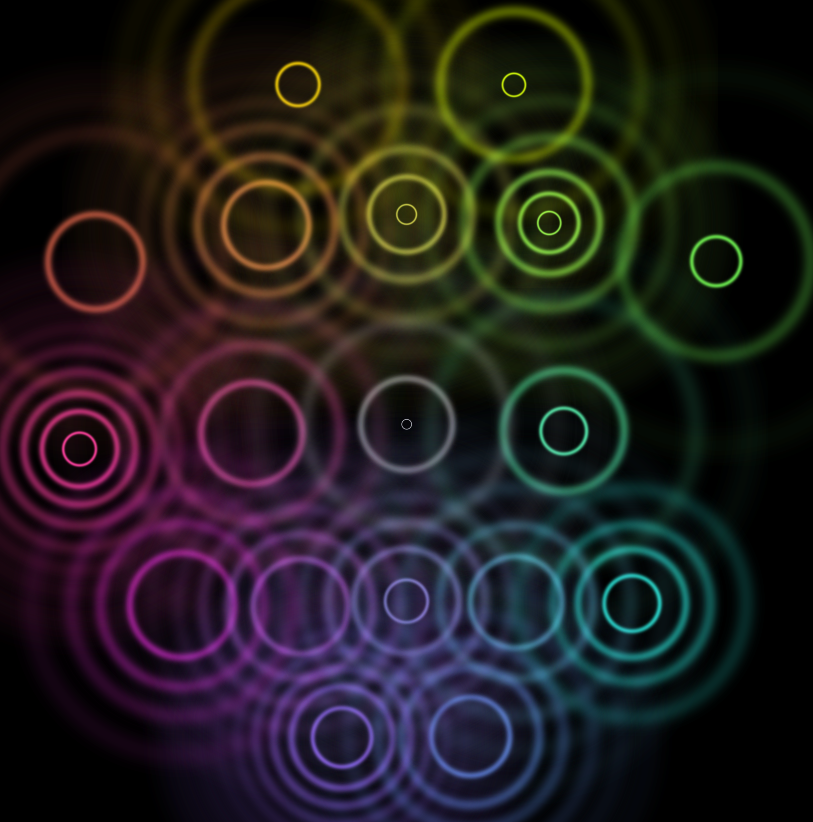
A topological 2D-display showing activities like ripples on a pond. When displaying time series data from spacial sources, there’s a trade-off between showing a map but only the current moment (like in voltage mappings), or showing the history but not the spacial layout (like in a curve display). Radiant Ripples is a topological display, visualising relative variance per channel by constantly expanding ripples of different frequency.
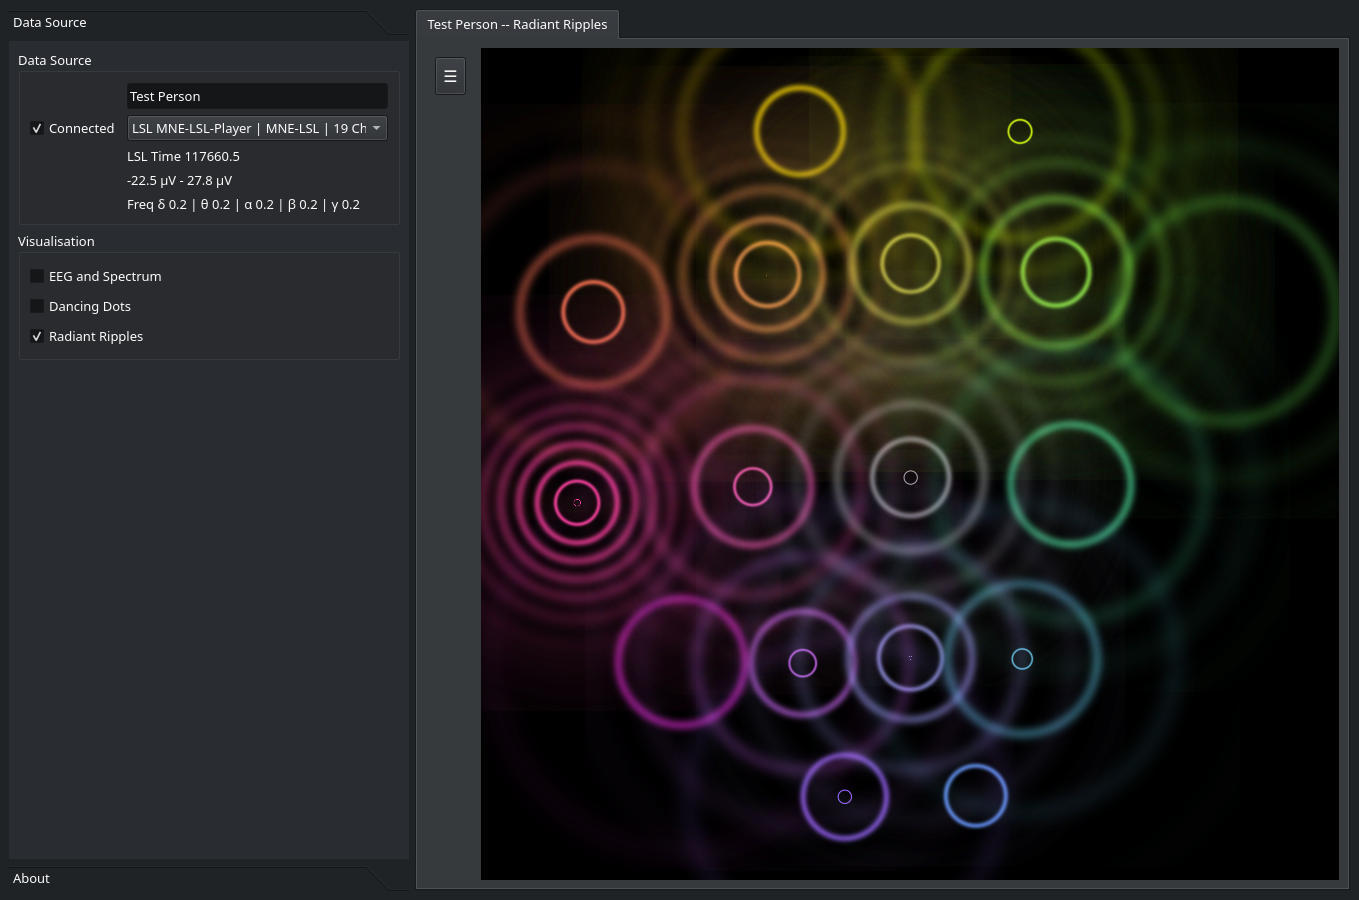 Ripples are expanding and fading. High-variance channels will produce many ripples, low variance channels few, or none. That way both topology (map layout) and history (two seconds of ripples, configurable) are combined. The ripples are colour-coded with a medical/nautical colour scheme (see under Data below).
| Frontal | Left Temporal | Occipetal | Parietal |
|---|---|---|---|
 |
 |
 |
 |
Ripple frequency and speed are configurable. A click into the display brings it to full-screen, another click brings it back. This display uses hardware acceleration (OpenGL).
Display: Standard EEG and Spectrum
Standard plots showing EEG and Spectrum. The data is shown as received via LSL. In the top middle there’s a standard EEG voltage curve view and to its left the relative variance over two seconds. On the right there’s a plot of the relative PSD. Bottom right has a bar diagram with the current frequency bands, and on the bottom the frequency band history.
 Please see the Data section below for details on what data is shown, and for the colour coding of the channels.
The variance history and the band history are shown with a logarithmic display — the longer ago the data has been, the more compressed it will get.
Please see the Data section below for details on what data is shown, and for the colour coding of the channels.
The variance history and the band history are shown with a logarithmic display — the longer ago the data has been, the more compressed it will get.
Data
Sources: LSL and Simulation
Data is received from an
- LSL stream which can be selected from a dropdown box on the left. In addition there is a
- selftest with five channels which runs through combinations of single frequencies so you can check the behaviour of spetrum displays.
Processing: Mean, Variance, PSD and Normalisation
Data is received from the stream in chunks of 200 ms. The
- PSD is calculated over the last two seconds (square of the norm of the FFT result) and normalised by the smoothed PSD history. This
- PSD history is calculated from the PSD mean over the channels, and updated every 200 ms by: new PSD = 0.99 * old PSD + 0.01 * raw PSD. The
- relative band power is the mean over all channels, integrated per frequency band (excluding DC), divided by the spectrum band width to prevent wider bands having more influence, then normalised so the sum of all bands is 1.0. In parallel, the provided
- relative variance is the variance over the last two seconds of EEG data, divided by the mean variance over all channels (such that the expected variance per channel is 1.0).
Colour Coding
In the Standard EEG/PSD view, and the Radiant Ripples view, channels are colour coded according to their location. A channel’s colour is a linear interpolation of the four colours red, yellow, green, and blue, where
- right-temporal (starboard) is green,
- left-temporal (portside) is red,
- frontal (bow) is yellow, and
- occipital (stern) is blue.
Installing and Running
Python Package
The software is a python package on PyPi. To install and run, do:
pip install samadhi
python3 -m samadhi
To uninstall:
pip uninstall samadhi
Python Source
Download the code from the repository, create a virtual environment (at your choice), install dependencies from the project.toml file, then run python3 -m samadhi the same way as after installing a package. Please note, sice the mne-lsl library is in the dependencies, there’s a very nice LSL simulator that plays an .edf file (mne-lsl player).
Software to run directly
In the releases section of the github project page there are software versions for Linux and Windows, to be run straight after downloading (made with pyinstaller).